
Cloud Server Architecture Patterns and Design Tradeoffs
 Reza Khosravi
Table of Contents
Your production stack sits in one availability zone. It has been quiet for eighteen months, the dashboards are flat, and then a network device in that zone drops a route and requests time out for forty minutes. In the retro someone says the obvious thing: add a second zone. Two weeks later the second zone exists, and the next incident still takes the whole service down, because both zones read configuration from the same deployment pipeline and both authenticate through the same identity provider. The redundancy was real. The protection wasn't.
That gap between "we added redundancy" and "we survived the outage" is what separates a design that reads well on a slide from one that holds under load. What follows is how an architect reasons through cloud server architecture: one layer at a time, with the tradeoff named at each step and the cost stated out loud. Along the way you'll see where abstraction helps, where it relocates risk, and how to decide which workloads deserve a second region.
The Core Layers Behind a Cloud Server
Cloud server architecture is the design of pooled compute, storage and networking exposed through an abstraction layer, so workloads get placed, moved and billed without anyone touching a specific machine. The honest analogy is the electricity grid. A bakery draws what it needs from a wall socket and never learns which generator supplied the circuit that morning. The grid absorbs the pooling problem so the bakery can think about bread.
A small shop without that pooling ran on one physical server in a single rack. Database on the same disk, cron job mailing the nightly backup to a personal inbox, no spare hardware. The rack's power supply failed on a Friday, the replacement part arrived Monday, and the business took orders by phone for three days. Nobody had been careless. The design had one of everything, so every component was a single point of failure.
NIST wrote the model down in Special Publication 800-145 in September 2011, and the NIST definition of cloud computing still works as a checklist. Five characteristics it calls essential: on-demand self-service, broad network access, resource pooling, rapid elasticity, measured service. Three service models: IaaS, PaaS, SaaS. Four deployment models: private, community, public, hybrid.
Read bottom to top, the stack answers one problem per layer:
- Physical hardware. Servers, disks, switches, power and cooling, owned by whoever can afford to replace a power supply on a Saturday.
- The hypervisor. Software that uses hardware virtualization extensions such as Intel VT-x or AMD-V to carve one host into isolated virtual machines, so four tenants share a box that used to serve one application.
- Virtual machines and containers. The unit of deployment, each with its own operating system image or filesystem view, rebuildable from a definition file instead of from memory.
- Orchestration. The scheduler that decides which host runs what, restarts what died, and drains a host before maintenance.
- Programmable APIs. The interface that turns provisioning into a call, which is what makes self-service and measured billing possible at all.
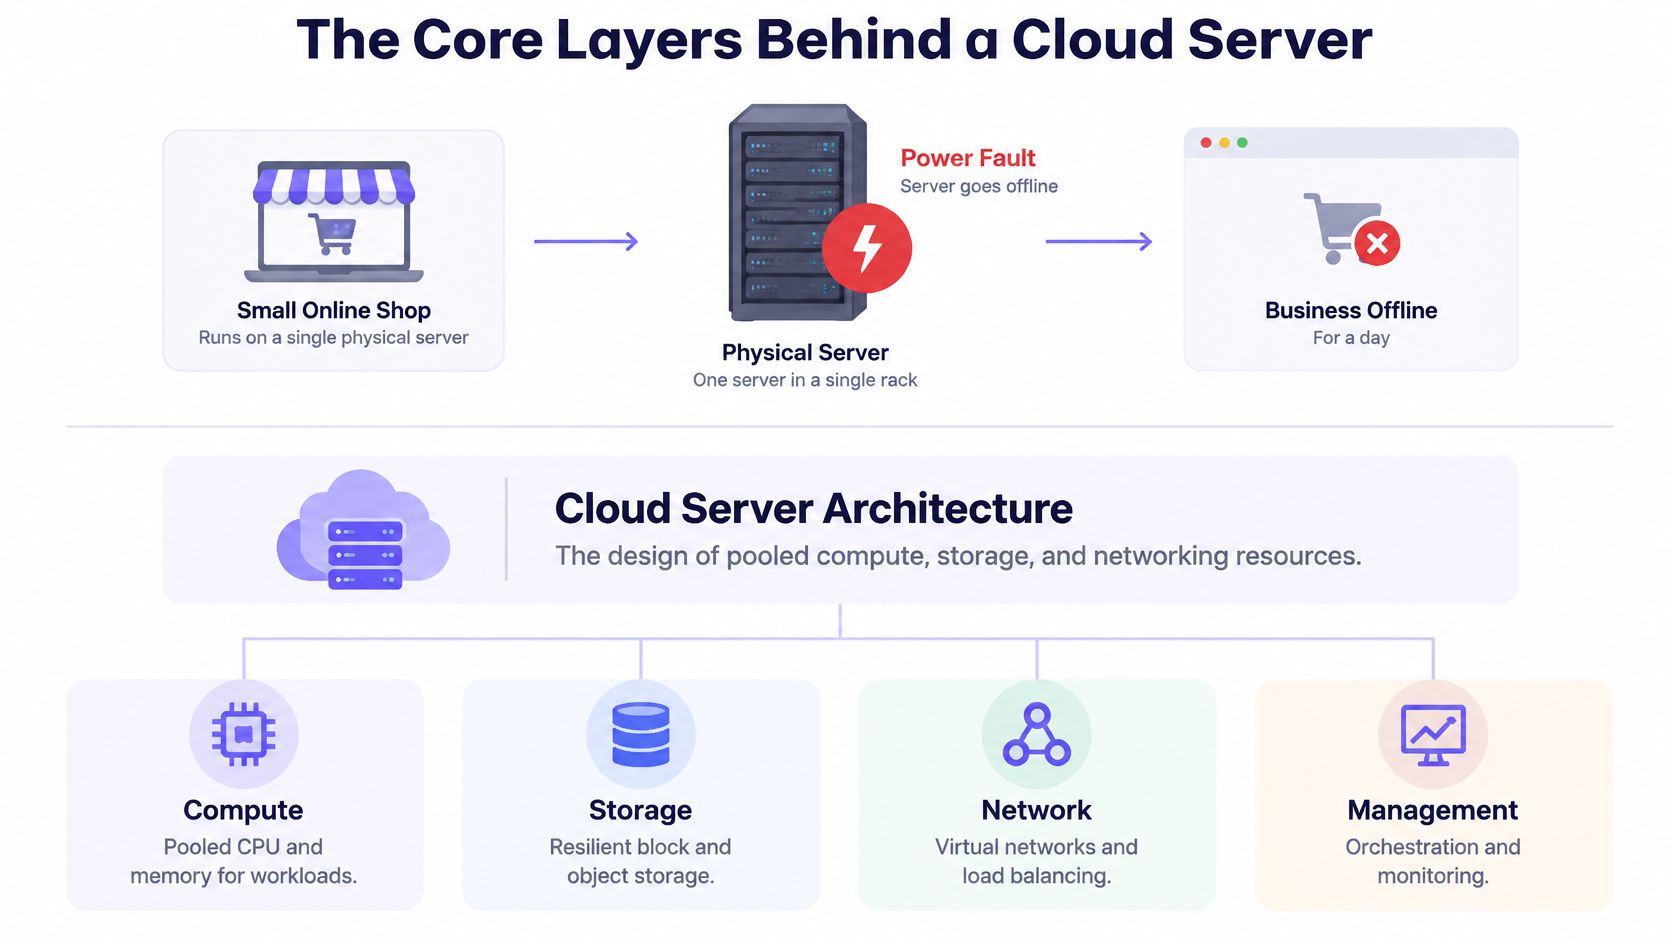
Two layers get confused most often, so separate them now. The hypervisor splits one machine into many; the orchestrator treats many machines as one. A team that buys orchestration tooling to fix a virtualization problem, or the reverse, pays twice.
Why did pooling replace one server per application? Because most of those servers sat idle. Server utilization in pre-virtualization data centers was typically low, and an NBER analysis of the virtualization buildout documents how consolidation changed the economics. If you're buying the pooled version rather than building it, the UpTime Web Hosting cloud hosting guide shows how shared infrastructure gets packaged into a single product for the customer.
Every decision later in this guide sits on one of those five layers, and the layers cut both ways: they isolate tenants from each other while funneling everyone onto the same identity, DNS and deployment services above the metal. When a design debate gets circular, name the layer. The argument usually resolves.
Architecture Patterns Compared at a Glance
| Pattern | Scaling unit | Operations burden | Failure isolation | Best fit |
|---|---|---|---|---|
| Single virtual machine | Whole VM | Low to moderate | Low, one host failure stops service | Internal tools, small sites, batch jobs |
| Tiered VMs with autoscaling group | VM instance per tier | Moderate | Medium, instances spread across zones | Traditional web and API applications |
| Containers on an orchestrator | Pod or container | High, cluster upkeep | High, self-healing and rolling updates | Microservices and frequent releases |
| Serverless functions | Individual request | Low, provider runs the servers | High, provider-managed isolation | Event-driven work and spiky traffic |
| Hybrid or multi-cloud | Per platform | High, two control planes | Highest on paper, but shared dependencies remain | Regulated workloads that must stay in one place |
Read the scaling-unit and operations-burden columns first, because they decide who carries patching, capacity planning and version upgrades. A team of four that can't take a cluster upgrade on a Tuesday night shouldn't run its own Kubernetes control plane, no matter how good the autoscaling story sounds.
Take a three-tier web application: a web tier serving pages, an API tier holding business logic, a database tier holding state. The web and API tiers can each run as VMs behind an autoscaling group or as containers on an orchestrator, and each gets its own scaling unit and its own deployment cadence. The database is a stateful service with different rules, which is why it can't be slotted into the same row as the other two.
The first three rows all exist because of the hypervisor. As the NIST virtualization guidance describes, a hypervisor abstracts CPU, memory, storage and network resources while letting a provider move a VM between hosts for maintenance and add capacity by expanding a cluster. Placement changes without application redesign. That's the whole payoff, and it's also how you end up with code that has never been tested against a host failure.
Two tests settle most pattern arguments. If your team cannot run the platform's upgrades and security patches on a schedule it controls, serverless or managed containers beat self-run VMs, because an unpatched hypervisor is a worse risk than a coarser scaling unit. If you release several times a day, containers on an orchestrator fit better than VMs you rebuild by hand, since rolling updates and self-healing come from the platform rather than from your runbook.
The abstraction also creates security obligations around tenant isolation, hypervisor configuration, virtual networking and privileged management planes, which is why application security architecture has to treat the hypervisor and control plane as shared trust boundaries rather than invisible plumbing. Those boundary consequences get their own treatment later.
Scaling Stateless and Stateful Tiers
Capacity grows in one of two directions. Vertical scaling means a bigger instance: more vCPU, more memory. It's the fastest fix available on a bad night, and it's bounded by the largest size the provider sells and by the fact that you still have exactly one of them. Horizontal scaling means more instances behind a load balancer. It has no hard ceiling, but it has a precondition that often becomes clear during the first incident.
The precondition is statelessness. If a web or API tier keeps session state in local memory, then a user's second request routed to a different instance looks like a logout, and scale-out turns into a bug generator. Move session state to a shared cache or into a signed token the client carries, and any instance can serve any request. Do this before you turn on autoscaling, not after.
Three triggers are worth wiring, and they cover most production shapes:
- CPU or request rate per instance against a target. Keep the target a band, not a point, so the group doesn't flap between adding and removing capacity every few minutes.
- Queue depth for background work. Queue length reflects actual backlog, while CPU on a worker waiting on I/O tells you nothing useful.
- A scheduled capacity floor for known peaks. Monday morning traffic and a marketing send are predictable; let a calendar event raise the minimum before the spike rather than after it.
Scale-out lag is the trap. New instances take minutes to boot, register and pass health checks, and autoscaling only reacts after a metric has already moved. Set the minimum capacity above your baseline spike and put a queue in front of bursty work so requests wait instead of failing.
Set the floor above the spike, not at it. A minimum that matches your average load means every peak starts with a capacity deficit you can't close fast enough.
Stateful tiers follow different rules. Read replicas absorb read-heavy traffic but introduce replication lag, so a user can write a comment and not see it on refresh. Partitioning takes over when a single primary runs out of write capacity, at the cost of cross-partition queries and a routing layer to maintain. Managed scaling options reduce the operational work and hide none of the semantics.
Before trusting any of it, load the system in staging to twice your expected peak and record which tier saturates first. That tier is your real scaling limit, and it's usually not the one on the diagram.
Designing Availability Across Failure Domains
Availability comes from counting how many independent things must fail before users notice. A region is a geographic area containing multiple zones, and zones are built to fail independently: separate power, cooling, and network paths. Two instances in different zones survive a local fault. Two regions add cover for a regional disaster, and they charge for it through consistency design, latency, and data-transfer cost.
The Google Cloud infrastructure reliability guide gives planning figures for the arithmetic: a single-zone deployment targets 99.9%, about 43.2 minutes of downtime in a 30-day month; multi-zone targets 99.99%, about 4.3 minutes; multi-region targets 99.999%, roughly 26 seconds. Treat them as architectural targets rather than promises for every workload.
| Deployment scope | Availability target | Allowed downtime per 30-day month |
|---|---|---|
| Single zone | 99.9% | about 43.2 minutes |
| Multi-zone within a region | 99.99% | about 4.3 minutes |
| Multi-region | 99.999% | about 26 seconds |
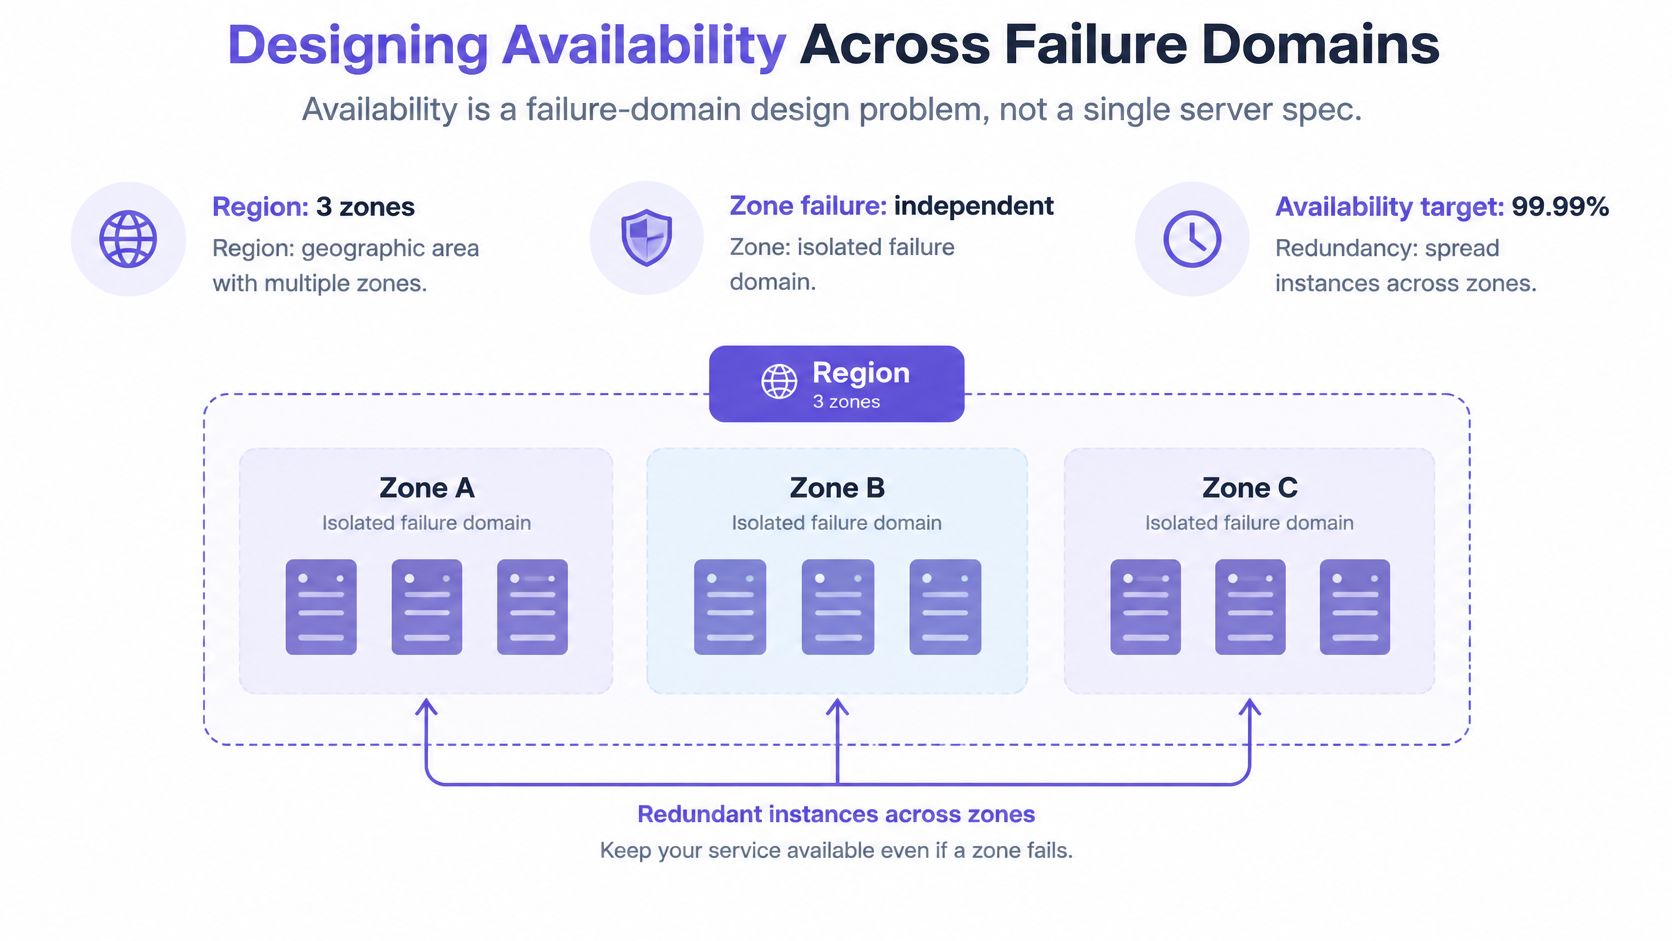
Run the numbers on a real deployment and the illusion breaks fast. An API with three replicas in a single zone tops out near 99.9%, because the zone is the failure domain and replica count adds nothing against a zone outage. Three replicas in three zones can plausibly reach 99.99%. Getting to 99.999% requires a second region and a replication design that doesn't hand you a new class of failure in exchange.
The same arithmetic extends beyond pooled cloud capacity. Dedicated or single-tenant capacity, including Solana Dedicated Nodes, has its own failure and maintenance profile, so assess it separately from pooled zone and region figures.
Count the failure domains per tier
Go tier by tier and write down how many independent failure domains each one uses. Web tier in two zones: two. Database with a single primary in one zone: one. DNS in a single zone hosted by the same account: one. Deployment pipeline running from one region: one. Every tier marked with a one is a place where the availability target you promised is fiction, and a tier that depends on a shared primary has a ceiling no instance count can lift. If both zones answer to the same control point, the second copy is a smaller shield than the diagram suggests, so record shared dependencies beside each count and choose the smallest scope that meets the workload's recovery target.
Hidden Dependencies That Break Resilient Designs
Most explanations of cloud resilience stop at compute: multiple zones, autoscaling, backups, a load balancer. They skip the harder question. What happens when deployment automation, identity, DNS, networking or the provider's management plane fails?
Outage analysis answers it with uncomfortable clarity. Of 62 major cloud outages since 2020, 55% began with configuration or deployment changes, software defects, or automation acting on bad input, rather than hardware failure, according to a 2026 cloud outage analysis. Uptime Institute data cited in the same analysis found 57% of surveyed organizations said their latest major outage cost more than $100,000, and one in five reported costs above $1 million. Hardware is not the thing that takes you down. Your own change pipeline is.
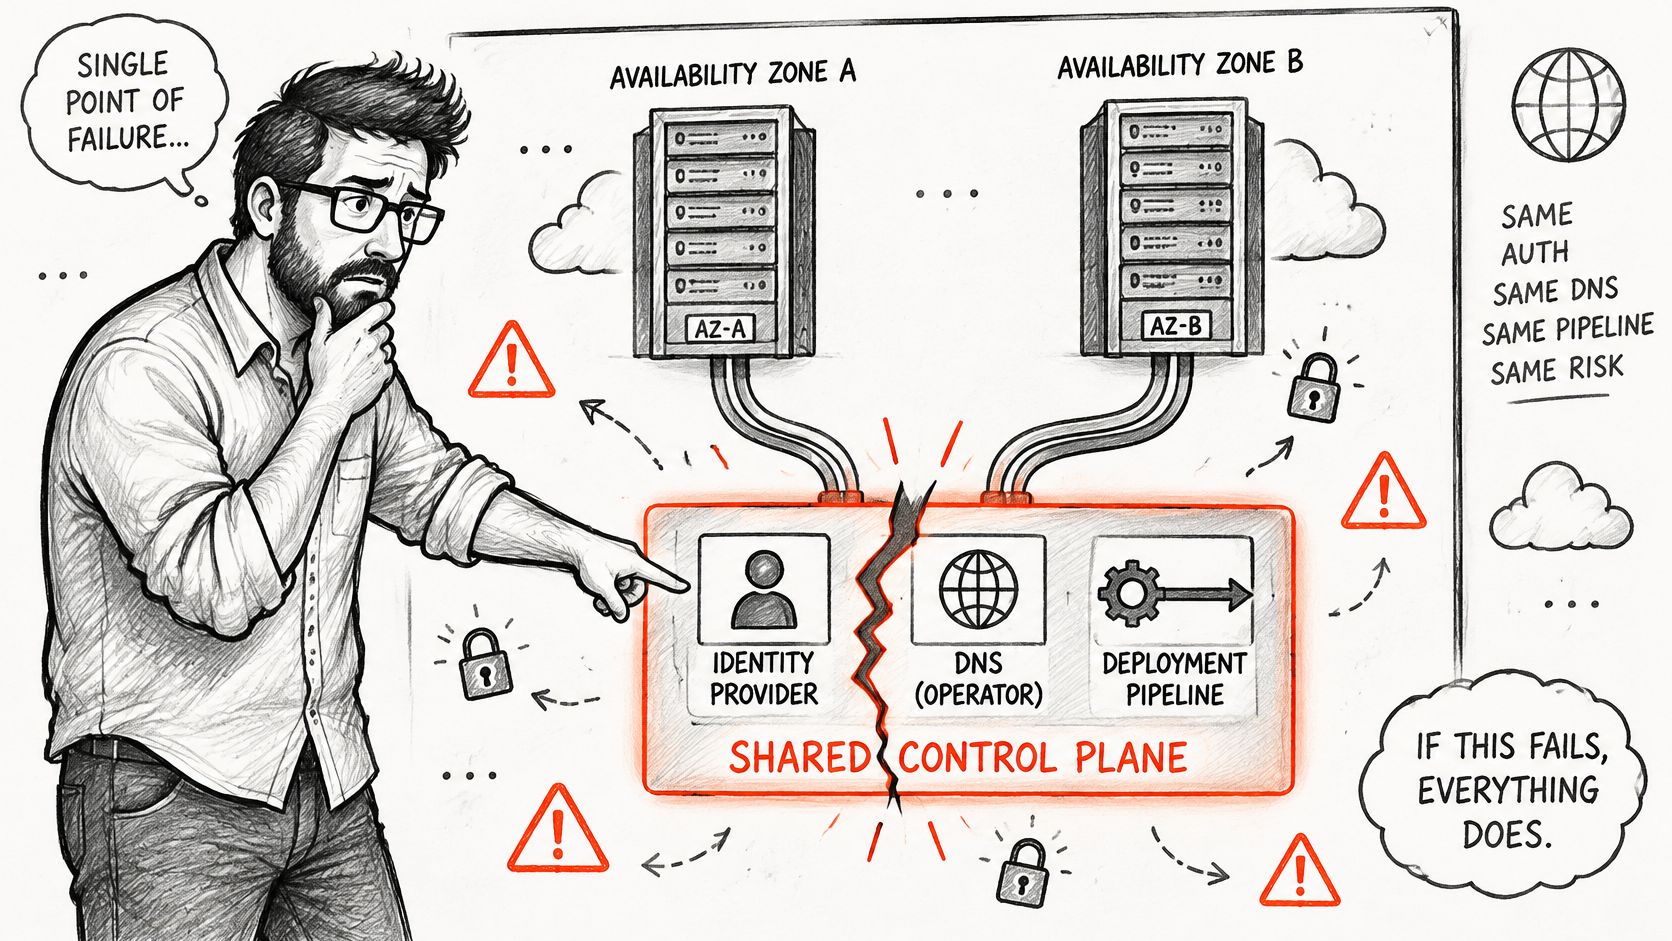
A second zone protects you only if the two zones don't share the thing that breaks. Map these six dependencies before claiming any availability figure:
- Identity and single sign-on. Gates both deployment and human recovery, which is why it's the first one to test.
- DNS. A single zone and a single registrar mean a control-plane mistake can make healthy infrastructure unreachable.
- CI/CD and deployment tooling. If the pipeline is down, your fix is stuck behind the outage it was meant to repair.
- Secrets management. Rotation failures lock out services and operators at the same moment.
- Network routes and edge services. Shared transit, shared WAF, shared CDN configuration: one bad rule, everything dark.
- The provider management plane. API throttling or a regional control-plane event blocks the automation you rely on.
For each dependency, answer three questions. Does it fail with the zone? Can a deployment still run without it? Who has authority to act when automation is unavailable?
Break-glass drill: name two people, issue offline credentials held outside the identity provider, write the manual path step by step, and have those two people execute it during a maintenance window. A procedure nobody has run is a paragraph, not a control.
Failure injection is the verification method. In staging, disable one dependency at a time, then try to deploy, roll back and fail over. Testing often reveals that the rollback path depends on the same service as the deploy path, which means the recovery plan is decorative.
Control-plane dependencies belong in the same threat model as application code, and cloud-native IaC threat modeling is where that mapping normally starts.
Matching Resilience Tiers to Each Workload
Multi-region active-active is treated as the default answer to an availability question. It rarely is. The right question isn't "which topology is most resilient?" but "which failure modes justify this cost and complexity for this service?"
Start with two definitions. RTO, recovery time objective, is how long the service can be down before the business is materially harmed. RPO, recovery point objective, is how much data you can lose, expressed as time. A team that can't answer both in numbers will default to the most expensive architecture on the menu, because cost is the only dimension it can reason about.
| Tier | Typical RTO | Typical RPO | Relative cost | Best fit |
|---|---|---|---|---|
| Backup and restore | Hours | Up to the backup interval | Lowest | Internal reporting, dev and test systems |
| Pilot light | Tens of minutes | Minutes | Low to moderate | Customer-facing tools with moderate tolerance |
| Warm standby | Minutes | Seconds to minutes | Moderate to high | Business-critical APIs with tested failover |
| Active-active multi-region | Seconds | Near zero, with replication lag | Highest | Payment and clinical services that cannot pause |
Those are typical ranges, and they shift with provider, data volume and how much of the stack you manage yourself.
Two workloads make the tradeoff visible. An internal reporting service that finance reads each morning can sit on backup and restore: a day of downtime delays a report, nobody is charged twice, and the recovery runbook is short enough to rehearse monthly. A card payment service is the opposite case. Recovery in seconds with no acceptable data loss pushes toward active-active with strong consistency controls, and it brings replication lag into your correctness budget, because two regions acknowledging a transaction independently can disagree about a balance.
The comparison of the most resilient cloud architecture options makes the cost side plain: active-active designs cut recovery time to seconds, cost substantially more, and introduce difficult data-consistency and replication problems. Jurisdiction is becoming another input rather than an afterthought, with Gartner forecasting worldwide sovereign-cloud IaaS spending at $80 billion in 2026, up 35.6% from 2025, as noted in that same comparison.
Write the decision record per workload
Each service needs a short record covering business impact, RTO and RPO, acceptable data loss, residency rules, replication lag, the named operational owner, and how often failover was last exercised. One page. It's the artifact that stops an argument about topology and turns it into an argument about a number.
The right tier is the cheapest one whose failover you have actually run this cycle. An untested active-active system is less reliable than a tested backup and restore plan, and it costs more.
Security and Compliance Boundaries in Regulated Designs
The boundaries come first, before any control. The shared hypervisor means other tenants run code on the same physical host as you. Virtual networking means isolation depends on rules someone can misconfigure. The privileged management plane means an identity with the right role can reach resources your application can't see. None of these are breaches. They're assumptions, and an assumption you haven't verified is a finding waiting on a reviewer.
The other half of the boundary is yours. Customers are responsible for securing their own environments, including repositories, CI/CD pipelines, secrets and credentials, and for configuring least-privilege access. A provider's compliance certificate covers the provider's building, not your deployment pipeline.
A reference architecture for a regulated payment API, built to close each boundary:
- Separate production and management accounts, so day-to-day application roles can't reach billing or account settings.
- Private subnets for application and database tiers, with no route from the internet to the database.
- A secrets vault issuing short-lived credentials, so a leaked value expires on its own.
- Encrypted storage pinned to the required residency region, configured at creation so data never exists outside it.
- Centralized audit logs, shipped to an account the application can't write to or delete from.
- A deployment path that cannot bypass policy checks, with no manual override that skips review.
| Control | Boundary it closes | Evidence item |
|---|---|---|
| Separate production and management accounts | Management plane access | Account role and access review |
| Private subnets for application and database tiers | Network path between tiers | Network diagram with segment rules |
| Secrets vault with short-lived credentials | Credential exposure window | Key rotation record |
| Encrypted storage pinned to residency region | Data location | Region and encryption configuration export |
| Centralized audit logs | Evidence of activity | Log retention and region report |
| Policy-gated deployment path | Change control | Change log with approval records |
Auditors ask for evidence, not intent. A network diagram with segment rules, a key rotation record with dates, a configuration export showing region and encryption settings: these are what convert a control into a finding you can close. Keep them generated by the pipeline on every change rather than assembled the week before an audit.
Three boundary questions deserve a written answer per system. Who can reach the hypervisor and the management plane, by role and by path? Which tenants share your host class, and does that match the isolation your contract assumes? Which logs leave the required region, and who authorized it?
The final test is independence. A control that depends on the same identity provider as the workload it protects is not an independent control, because one failure disables both the thing and its guard. Verify each one against what it shares, whether that's the pipeline, the DNS zone or the account structure. For teams running this pattern on AWS, the practical ordering of controls and evidence is covered in this AWS cloud security review.
Turn Your Design Into a Decision Record
A design that exists only in a whiteboard photo and three engineers' heads fails its first audit and its second handover. Assemble it as an artifact that lives next to the infrastructure code, written for the person who inherits it rather than the person who drew it.
The sequence that works:
- Build a workload inventory from tickets, design documents and repositories, one row per service. An inventory often reveals more services than the team expected, especially ones nobody has owned since their original launch.
- Attach a decision record to each row, with the RTO, RPO, cost tier and a named owner who can defend the choice. A tier without a defender drifts toward whatever is cheapest that quarter.
- Attach the dependency map and the result of each failure-injection test. The map should name the shared pieces each service relies on: the identity provider, the DNS zone, the deployment pipeline, the management plane. Those are the dependencies that turn a single-zone failure into a full outage, and they are the ones a second region does not protect you from. Mark tests you didn't run as not run, because a blank cell gets read as a pass.
- Confirm the named people have walked the break-glass path, not just signed off on the document. The difference shows up at 2 a.m.
- Attach the evidence item behind each regulated control, so the compliance question is a lookup rather than a project.
The record is what proves the design, to auditors and to whoever inherits the service in eighteen months. Store it beside the Terraform or CDK, and update it whenever a dependency changes. A stale dependency map is worse than none: it tells you a risk has been reviewed when what was reviewed is an older system.
DevArmor's threat models and architecture reviews are generated in minutes from artifacts a team already has, which covers the documentation half of this work. The evaluation stays with you: running the failure-injection tests, reviewing the output through your own code review and security testing, and confirming the design still holds when something fails.
Every workload tiered. Every dependency tested. Failover exercised within the last cycle. Those three lines are the whole review agenda.
The first question to answer, before any of the rest, is the one that decides your next incident. Which dependency would take the entire service down if it failed today?
DevArmor builds continuous threat models and architecture reviews for cloud server architecture work, generating them in minutes from the tickets, design documents and repositories your team already has, then checking every change against the approved design decision. You can get a personalized demo from DevArmor's founder and see it applied to one of your own systems. Visit DevArmor to put your dependency map and control evidence into a living record instead of a document that goes stale.
Table of Contents
Subscribe


