Attack Surface Analysis: A Practical Guide for Modern Teams
 Reza Khosravi
Table of Contents
The pull request looked harmless. A frontend engineer had added a temporary integration for a sprint demo, deployed it to staging, and moved on when the feature was cut. Eight months later, a product security engineer searching the organization's public inventory found the old API still answering requests.
The endpoint wasn't listed in the current service catalog. Its original owner had changed teams, the repository README still described the feature as experimental, and several deployments had passed without anyone revisiting the route. Access logs stored in S3 showed recurring requests from outside the corporate network. The endpoint didn't expose a complete database, but its permissive CORS policy allowed browser-based callers from origins the team hadn't approved, and the route returned metadata that should never have been publicly reachable.
The discovery landed in a Slack channel, then became an incident ticket. Engineers traced the endpoint to an old pull request, found the infrastructure change that kept its staging load balancer alive, and confirmed that the feature's sunset ticket had removed the UI without removing the API. The immediate fix was straightforward. The difficult question was why the organization had no dependable way to notice the mismatch earlier.
That question defines attack surface analysis. Modern teams need a repeatable way to discover what they've exposed, understand which controls protect each entry point, prioritize realistic paths to harm, and connect every mitigation to the design or code change that created it. The answer shouldn't be a quarterly spreadsheet. It should be a living engineering artifact that changes with repositories, tickets, infrastructure, identities, and AI-assisted code.
The Forgotten Endpoint That Started a Real Incident
The investigation began with an inventory discrepancy, not an alert. The service catalog listed the production API and a private test service, but an external discovery check found a third hostname that returned a valid response. The hostname still resolved through the team's cloud routing layer, even though the product page and frontend code that once called it had disappeared.
Following the evidence trail
The engineer opened the access logs in the organization's S3-backed logging store and searched for requests to the retired route. The records showed that the endpoint wasn't dormant. Clients had continued to reach it after the feature was removed, and the request pattern included browser-origin headers that made the permissive CORS policy relevant. The team couldn't infer malicious intent from those requests alone, but it had enough evidence to treat the exposure as real.
The ticket history filled in the ownership gaps:
- Original implementation: A sprint-demo ticket introduced the route and a temporary staging deployment.
- Infrastructure change: A pull request added the load-balancer rule and environment configuration.
- Feature removal: A later ticket removed the frontend flow but didn't reference the API or infrastructure.
- Ownership transition: The original engineer moved teams, while the service catalog retained no active owner for the staging hostname.
The fix included disabling the route, removing the routing rule, reviewing the logs, and assigning ownership for the remaining staging assets. The post-incident discussion focused less on the individual mistake than on the missing connection between product work, deployed interfaces, and retirement decisions.
Practical rule: An endpoint isn't retired when its button disappears. It's retired when the route, deployment, identity, data access, and external reachability have all been checked.
The forgotten API is a useful model for a broader problem. Code changes faster than inventories, cloud resources outlive the feature that created them, and AI coding agents can introduce routes or integrations without making every security consequence obvious to a human reviewer. Attack surface analysis gives teams a way to keep the model aligned with reality.
What Attack Surface Analysis Actually Means
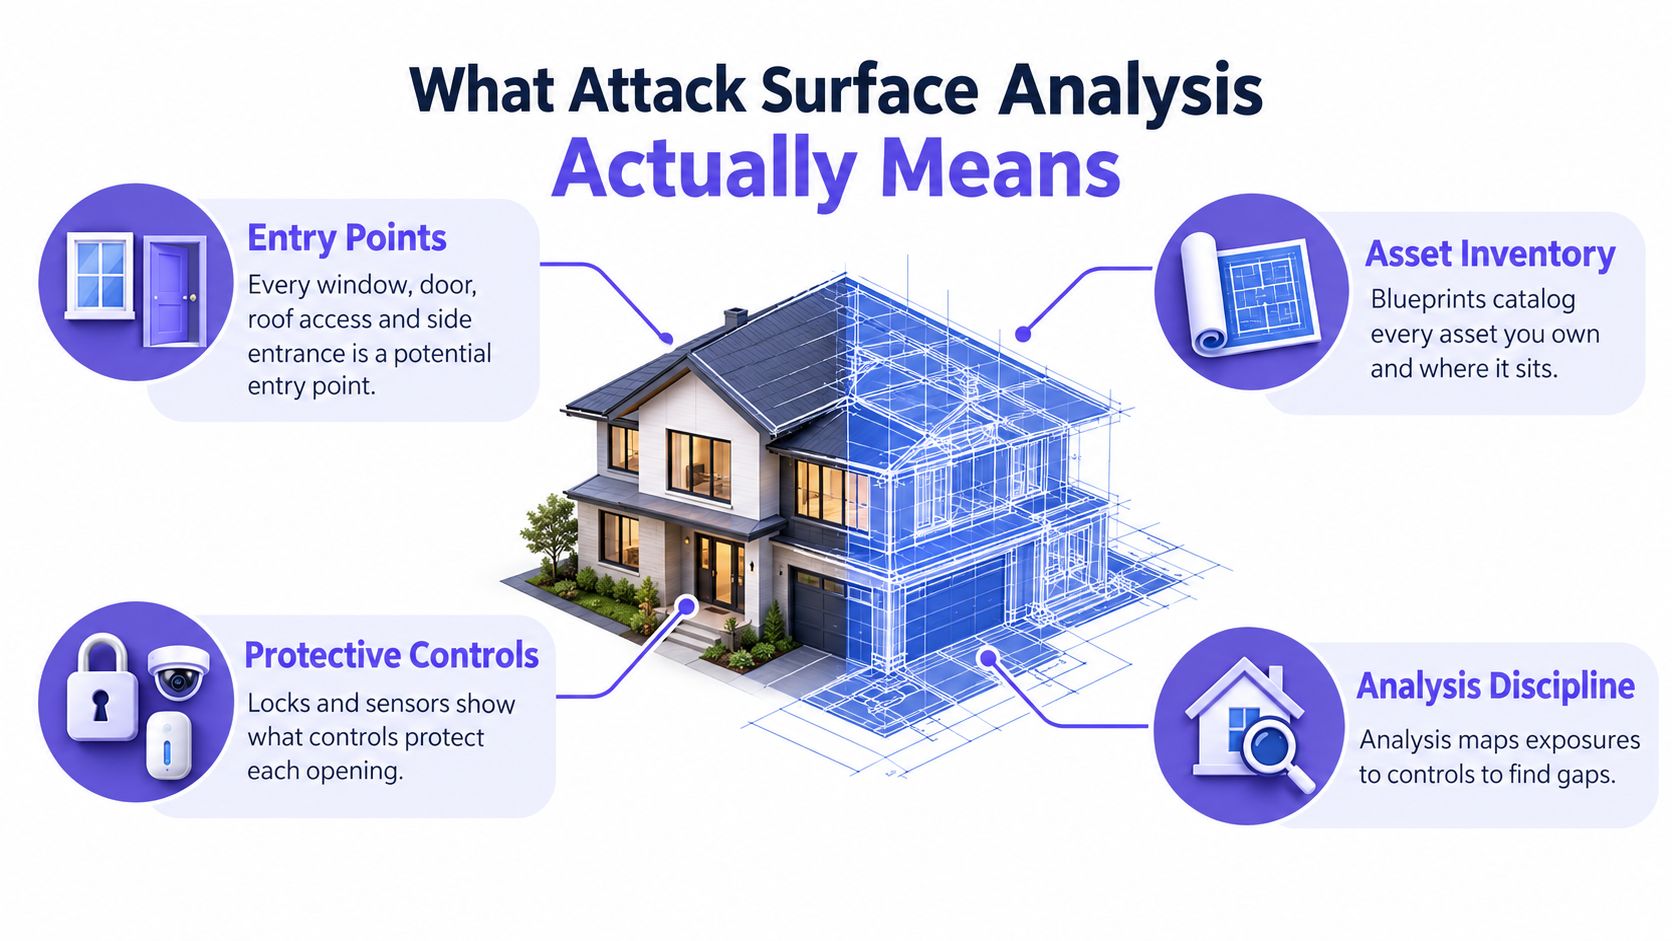
Start with a house. Its windows, doors, roof access, and side entrances are possible ways in. The blueprints tell you which rooms and utilities exist. Locks, alarms, cameras, and sensors show how each opening is protected. A security review that only counts broken locks misses an unlisted door. A review that only studies the blueprint misses the window someone installed afterward.
Software has the same relationship between exposure and protection. The entry points might be web routes, mobile APIs, message consumers, administrative consoles, file-upload handlers, webhooks, or agent tools. The channels include HTTP, queues, database connections, identity providers, cloud control planes, and third-party integrations. Untrusted data crosses those boundaries through requests, events, files, prompts, and external responses.
Carnegie Mellon researchers formalized this idea in 2007 through An Approach to Measuring A System's Attack Surface. Their method treated attack surface as a measurable combination of entry points, channels, and untrusted data items, scoring components through a damage-potential-to-effort ratio. That work helped move attack surface analysis from a qualitative concern toward a structured metric that teams could compare as designs changed. The broader framework remains useful because it asks a practical question: did this design change expand or reduce exposure? Unit 42's overview of attack surface research provides the historical context.
The technical map
OWASP describes an application's attack surface as the sum of paths for data and commands into and out of the application, the code protecting those paths, and the valuable data the application handles. That protection includes authentication, authorization, validation, encoding, and logging. OWASP's attack surface analysis guidance recommends grouping attack points by risk, counting their types, and focusing review effort on representative high-risk interfaces and changes.
Attack surface analysis isn't the same as vulnerability scanning. A scanner may identify a known vulnerable package or weak configuration, while analysis asks whether the package is reachable, what identity is required, which data sits behind it, and which controls reduce the path.
It also isn't a complete threat model or a penetration test. Threat modeling explores misuse and attacker objectives. Penetration testing validates behavior through controlled attack activity. Attack surface analysis maintains the exposure map those activities depend on.
A useful map records each asset, entry point, channel, trust boundary, protective control, data type, owner, and source artifact. Treat that map as a living design artifact, not an audit document. If a route changes in a pull request, an IAM role changes in infrastructure code, or an AI agent adds a new tool call, the model should show the resulting delta.
Organizations evaluating their baseline through an SMB cyber security evaluation can use the same principle: assess not only whether a control exists, but whether the inventory accurately reflects what the business has exposed and who owns it.
The Five Layers Every Attack Surface Spans
A flat list of domains and IP addresses rarely explains how an attacker moves through a product. A customer-facing application may begin with a public route, pass through an identity provider, reach a service account, query sensitive data, and then send information to a third-party processor. The risk lives in the connections between layers.
| Layer | What Belongs Here | Commonly Overlooked Example |
|---|---|---|
| Code | Routes, RPC handlers, scheduled jobs, feature flags, upload paths, and dependency-exposed APIs | A disabled-looking feature flag that still leaves an administrative handler reachable |
| Infrastructure | Cloud accounts, buckets, databases, load balancers, containers, serverless functions, and shadow SaaS | A temporary staging resource retained after the product feature is removed |
| Identity | Human users, service accounts, machine identities, OAuth scopes, API keys, and agent credentials | An AI pipeline identity that can invoke tools beyond the task it was created to perform |
| Data | Primary stores, backups, analytics warehouses, exports, and logs | Application logs that retain personal information copied from request payloads |
| External risk space | Scripts, widgets, partner APIs, embedded content, advertising systems, and runtime context providers | A third-party prompt or content source that can influence an AI feature's behavior |
Code creates the opening
The first layer is visible in repositories, but it's broader than controller files. Background jobs may process attacker-influenced messages. Feature flags can preserve old paths. Dependencies can expose documentation or debug interfaces. A route that appears internal may still be reachable through a gateway rule or a forgotten service-to-service path.
Infrastructure determines whether that code can be touched. A private application behind a correctly configured gateway has a different exposure from the same application attached to a public load balancer. Cloud resources also change independently of application releases, which is why infrastructure-as-code and live cloud inventory need to be reconciled.
Identity and data decide the consequence
Identity turns a reachable interface into an authorization question. Track human accounts, service accounts, pipeline identities, OAuth scopes, delegated permissions, and long-lived keys. AI agents deserve the same treatment. An agent that can read repositories, call deployment tools, or retrieve customer context has a machine identity and a set of channels that belong in the model.
Data then determines what an attacker could affect or extract. Include backups, warehouse tables, exports, observability systems, and logs, not only the database named in the architecture diagram.
The external layer is where many teams undercount exposure. Third-party scripts, partner integrations, fake applications, lookalike domains, phishing infrastructure, and brand abuse may sit outside owned infrastructure while still affecting users and business trust. A recent industry discussion calls this attacker-controlled space “the other half” of the attack surface, while the 2025 SANS ASM survey summary reports that 55% of organizations want ASM to cover both internal and external assets, while only 28% of tools effectively identify sensitive data across the environment.
Mapping Assets and Entry Points from Real Artifacts
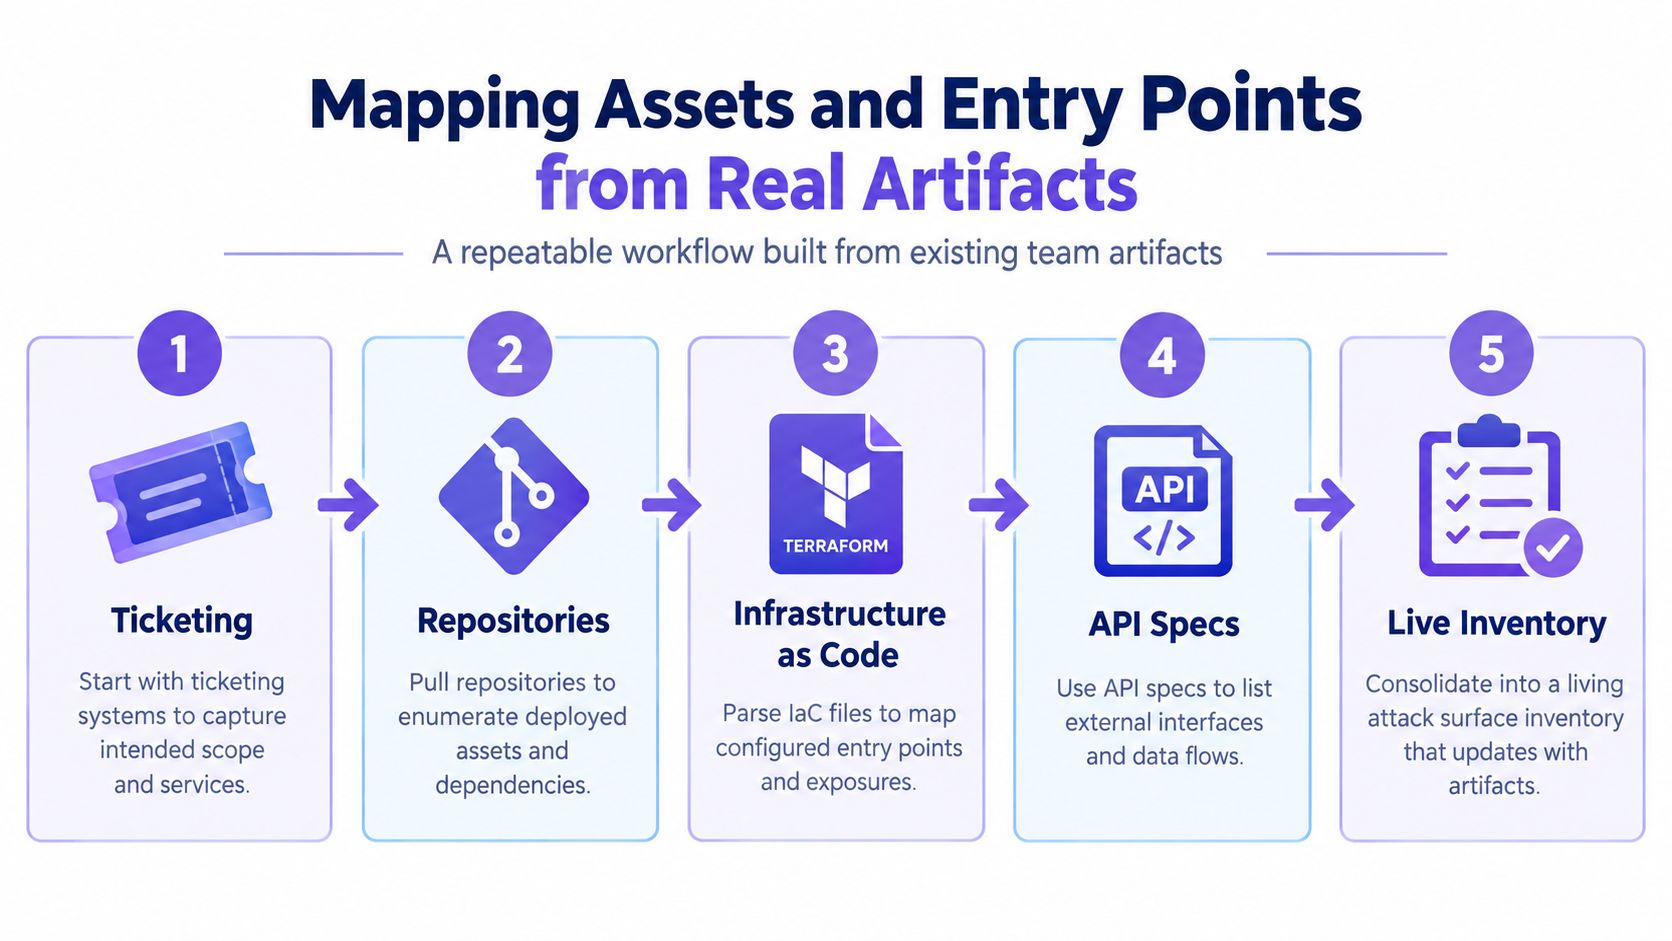
The most reliable inventory starts with work the team already performs. Don't begin by asking a scanner to guess ownership. Begin with the artifacts that explain why a service exists, what it changed, and what should happen next.
Build the model from intent and implementation
Pull epics, tickets, RFCs, and architecture proposals that introduced services, interfaces, data flows, or integrations. Then compare that intended scope with merged pull requests. A ticket describes what the team planned. The merged code, deployment configuration, and resulting cloud resource show what shipped.
Repositories provide the next layer of detail. Parse README files, OpenAPI documents, gRPC protobufs, Helm charts, and infrastructure-as-code modules. These artifacts can enumerate hosts, routes, ports, queues, secrets references, outbound dependencies, and environment-specific behavior. Treat every result as a candidate until you can connect it to a deployed asset and an owner.
Add identity and institutional memory
Cross-reference the application map with SSO groups, service-account inventories, cloud IAM roles, OAuth registrations, and pipeline permissions. Machine identities often don't appear clearly in application documentation, yet they determine which paths an attacker can use after compromising a service.
Then search architecture decision records, threat models, onboarding notes, and runbooks. These documents preserve assumptions such as “only the internal job calls this route” or “this bucket is temporary.” Those assumptions need verification, not automatic trust.
A practical inventory record should include:
- Entry point: Route, queue, job, console, integration, or tool.
- Asset and owner: Repository, service, cloud resource, and accountable team.
- Trust boundary: Public, partner, employee, service-to-service, or agent-controlled.
- Controls: Authentication, authorization, validation, network policy, logging, and rate limits.
- Data and impact: The information handled and the action available.
- Evidence: Commit, ticket, RFC, ADR, deployment, or live discovery result.
- Lifecycle state: Proposed, active, deprecated, retired, or unknown.
Teams that need a broader view of publicly visible organizational information can also consult guidance on how to analyze digital footprints, then apply the same evidence-based discipline to owned technical assets. For the design side, connect this inventory with the threat modeling process so entry points and trust boundaries remain tied to decisions rather than isolated spreadsheet cells.
The result should be queryable. If a pull request changes an API specification, the system should identify affected entry points, controls, owners, and data flows. If no owner exists, that's not a documentation inconvenience. It's an exposure-management finding.
Why Continuous Detection Beats Quarterly Snapshots
A quarterly review assumes the environment can wait for the next review. Modern cloud systems don't behave that way. Unit 42 reported in 2024 that an organization's attack surface added over 300 new services per month on average, and those additions accounted for nearly 32% of new high or critical exposures. The same research found that over 23% of exposures involved critical IT and security infrastructure, while media and entertainment organizations added more than 7,000 services per month. Unit 42's 2024 attack surface research makes the operational issue clear. A review cadence can't describe a surface that changes continuously.
The earlier Unit 42 research cited in that report found that, in a given month, about 20% of an organization's cloud attack surface was taken offline and replaced with new or updated services, while 80% of medium, high, and critical exposures were in cloud environments. It also found that over 85% of organizations had RDP internet-accessible for at least 25% of the month. These figures don't mean every exposure is exploitable. They show why a static inventory becomes stale quickly.
| Dimension | Quarterly Snapshot | Continuous Detection |
|---|---|---|
| Trigger | Scheduled review | Pull request, IaC change, identity grant, deployment, or discovery event |
| View | Current state at review time | Delta from the last known state |
| Ownership | Reconstructed manually | Attached to repository, service, and team metadata |
| Triage | Large periodic backlog | Smaller changes routed as they occur |
| Retirement | Often discovered late | Flagged when code and infrastructure disagree |
Make change the unit of work
Webhook-driven parsers can ingest repository events and infrastructure diffs. Scheduled reconciliation can compare cloud resources, DNS records, certificates, service catalogs, and identity systems against the baseline. New hosts, routes, roles, queues, domains, or external dependencies should create a review item with evidence, not just an alert.
A delta view is easier to reason about than a complete census. “This pull request introduced a public route that handles customer data and lacks the required authentication scheme” gives an engineer a decision. “Your organization has many assets” does not.
Teams can pair this workflow with a practical 2026 data security guide when reviewing data handling, retention, and access controls. They can also connect the model to continuous threat modeling, so design context updates when the artifacts that describe the system change.
Tying Mitigations Back to Approved Design Decisions
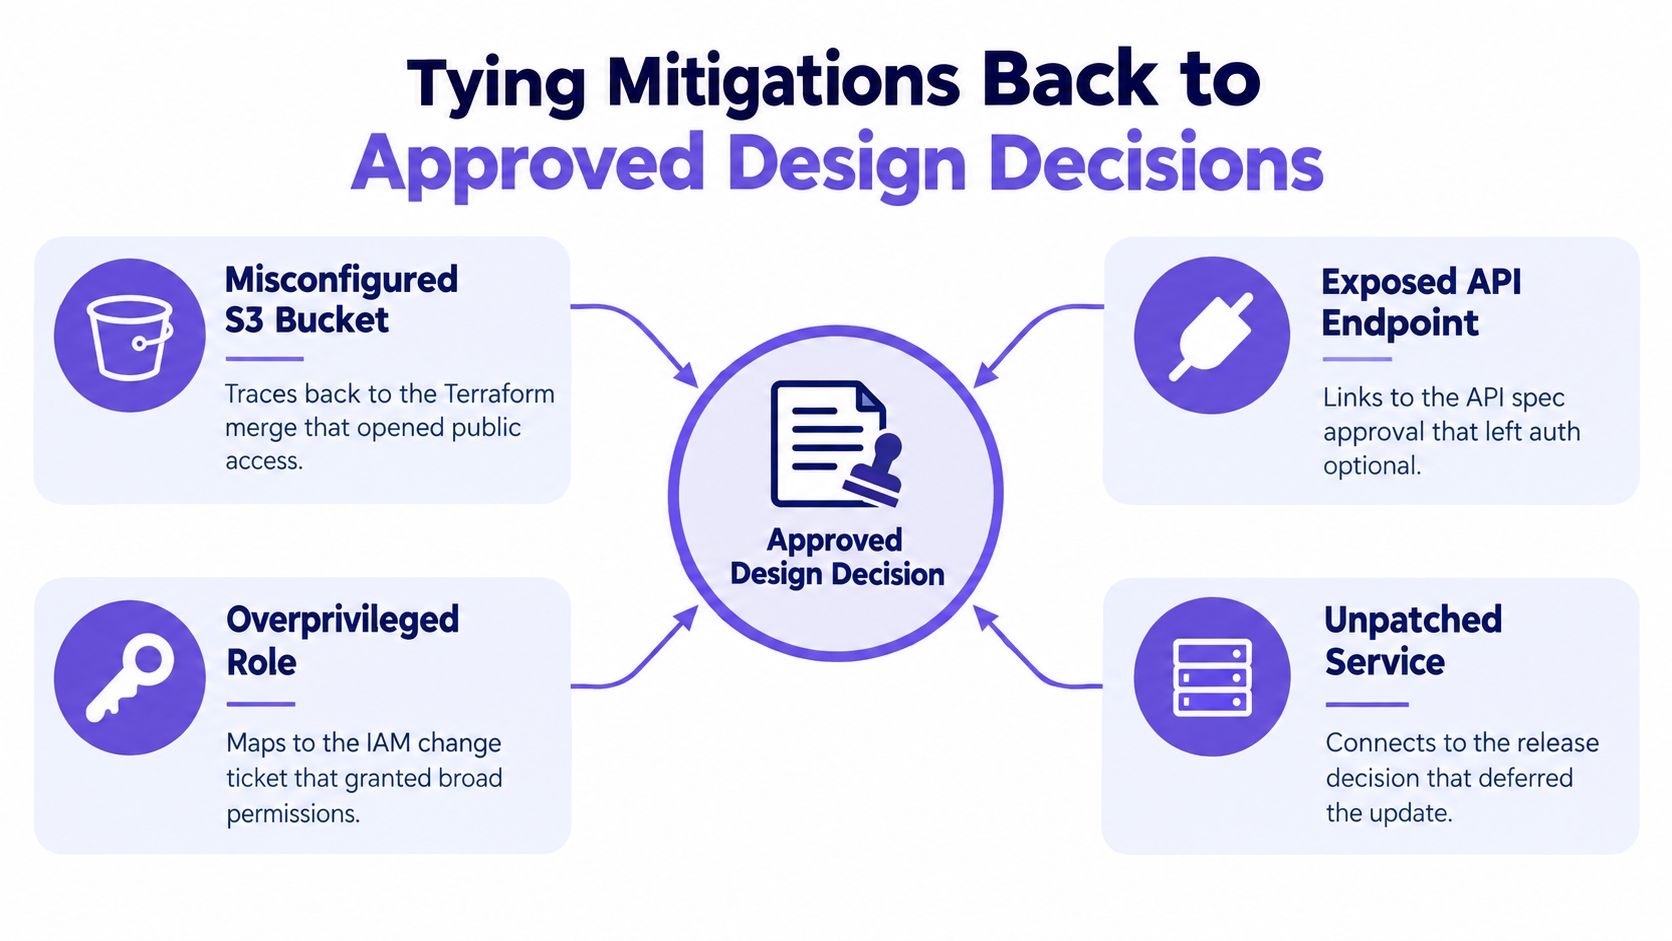
A security finding becomes durable when someone can explain why the control exists and which approved decision it enforces. Without that link, a remediation may be patched locally and then undone by the next developer who sees an unexplained restriction.
Consider a public S3 bucket. The useful record isn't only “bucket is public.” It should identify the Terraform merge that created public access, the ticket that requested the storage resource, the data classification, and the approved alternative if public access wasn't intended. An unauthenticated administrative endpoint deserves the same treatment. Link it to the RFC that justified internal-only access, then verify whether the current network and identity controls still support that assumption.
Turn decisions into enforceable rules
Policy-as-Code works best when it expresses a recorded decision rather than a vague security preference. A rule might reject new public storage, require mutual TLS between named services, or block an API route that lacks the authentication scheme specified in an approved design.
The review experience should answer four questions:
- What changed? Identify the commit, pull request, Terraform plan, or deployment.
- Which exposure changed? Show the affected route, asset, identity, data flow, or trust boundary.
- Which decision applies? Link the relevant RFC, ADR, threat model, or policy.
- What happens next? Block, warn, assign, or request an explicit exception.
This approach changes the conversation in code review. Engineers aren't debating whether security wants a rule. They're checking whether the proposed implementation matches a decision the organization already approved.
The strongest mitigation is one the next engineer can understand before they remove it.
A platform such as DevArmor can connect design artifacts, repositories, infrastructure context, policy enforcement, and implementation verification in the same workflow. Its implementation verification capability is relevant when teams need to trace an approved design decision through code changes and deployments. The important outcome isn't the tool itself. It's the audit trail from exposure to decision to enforcement.
When requirements change, update the decision and its policy together. That keeps exceptions visible and prevents old assumptions from becoming permanent architecture.
The Uncomfortable Truth About Findings and Remediation
More findings don't automatically mean stronger security. A scanner can report two issues with the same severity while the actual exposure differs because one route is public and unauthenticated, the other sits behind strong authorization, and the data or action available through each path isn't comparable.
Arctic Wolf reported that 33% of IT assets were missing at least one critical control, including assets invisible to legacy vulnerability tooling. A separate 2026 benchmark claimed only 0.47% of scanner findings were exploitable. Those figures come from different sources and should not be treated as a universal conversion rate. Together, they highlight a real operational tension: teams may lack important controls while still spending time on findings that don't represent a practical attack path. Arctic Wolf's attack surface report discussion provides the cited context.
| Dimension | Raw Finding View | Control-Adjusted View |
|---|---|---|
| Reachability | Vulnerable component exists | Confirm whether an attacker can reach it |
| Identity | Authentication status is a field | Evaluate required identity, scope, and privilege |
| Data | Severity score dominates | Include sensitivity and business consequence |
| Controls | WAF, policy, and segmentation are separate notes | Treat effective controls as part of the exposure path |
| Action | Add another ticket | Remove, restrict, isolate, monitor, or accept with evidence |
Prioritize the path, not the label
Before assigning remediation work, establish whether the finding maps to a live entry point. Filter duplicate results, unreachable services, retired assets, and issues already mitigated by a verified control. Then assess internet reachability, authentication requirements, authorization scope, data class, exploit conditions, and the possibility of chaining with another weakness.
This doesn't mean teams should ignore low-severity defects. It means they should distinguish a code-quality issue from an exposure that an attacker can realistically use. A backlog of 40 well-understood exposures tied to live entry points can support better decisions than thousands of disconnected scanner alerts. That comparison is qualitative, not a measured industry benchmark.
Defending this model during planning takes discipline. Product teams may prefer visible ticket counts, while security teams may prefer detection output. The useful measure is whether the organization is reducing exploitable exposure and validating the controls that make a path safe.
Putting It All Together and Knowing What Comes Next
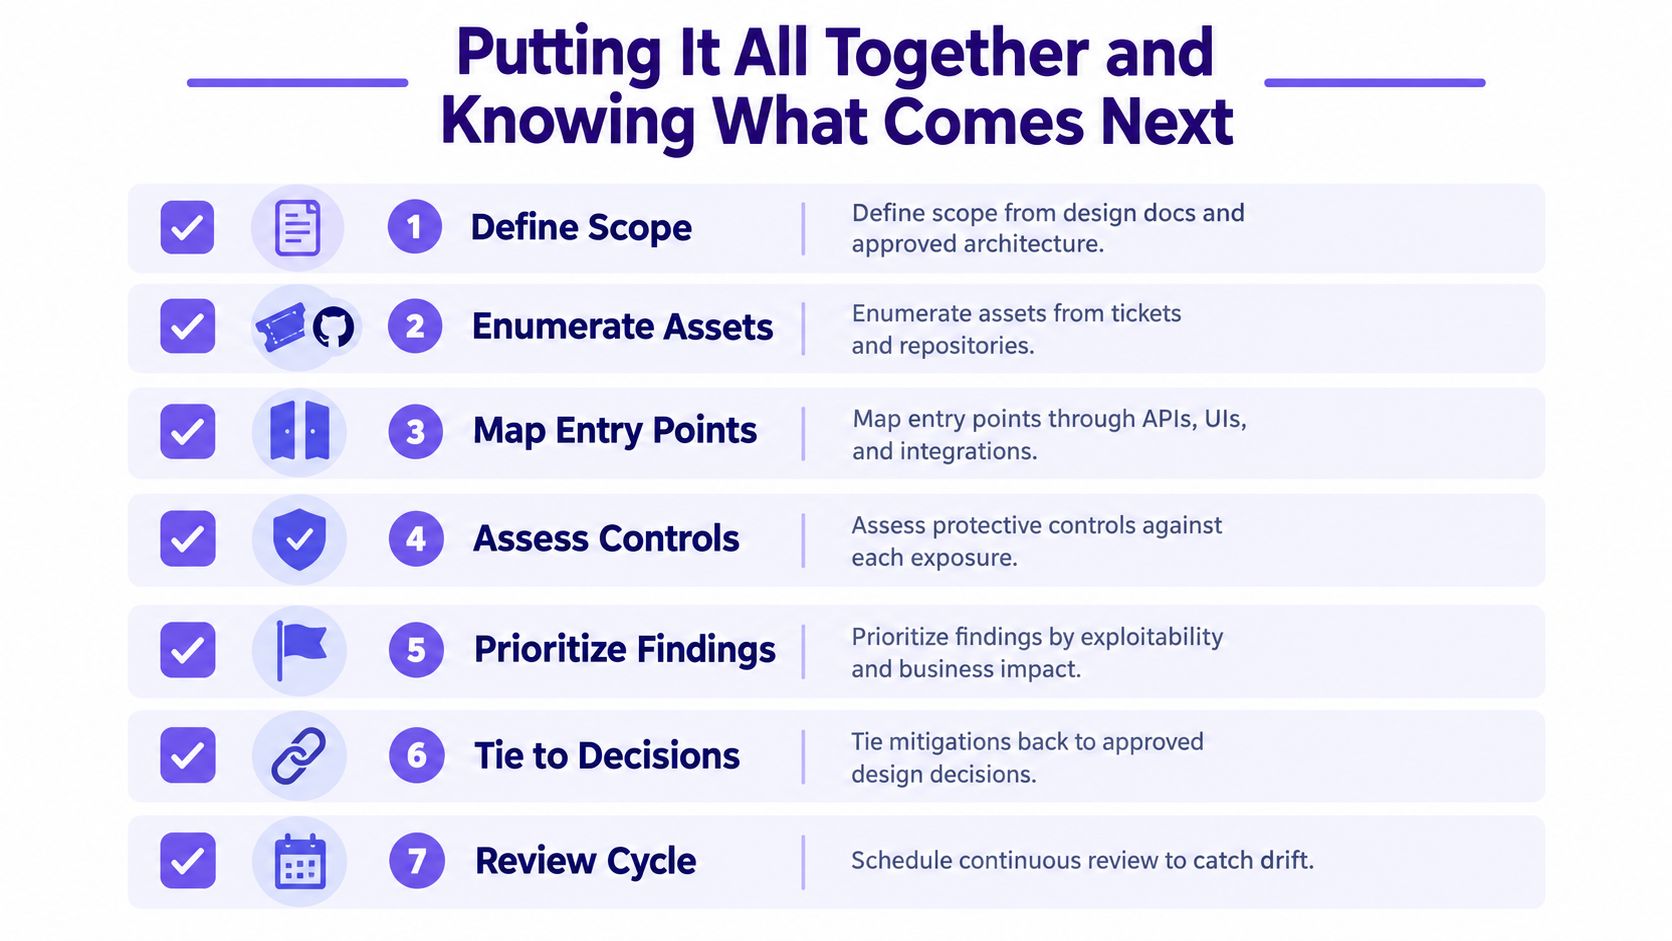
Attack surface analysis becomes manageable when every activity produces an artifact someone else can inspect. The following runbook keeps the work attached to delivery rather than separating it into a security calendar.
- Define scope: Use approved architecture, RFCs, ADRs, and threat models to record systems, trust zones, data flows, and intended interfaces.
- Enumerate assets: Pull services, repositories, cloud resources, queues, identities, integrations, and owners from tickets, source control, IAM, and infrastructure metadata.
- Map entry points: List APIs, user interfaces, jobs, message consumers, admin tools, file paths, webhooks, and AI agent tools.
- Assess controls: Record authentication, authorization, validation, network restrictions, secrets handling, logging, and policy enforcement for each exposure.
- Prioritize findings: Use reachability, identity, data sensitivity, exploit conditions, and compensating controls to distinguish live exposure from noise.
- Tie mitigations to decisions: Link every fix, exception, and policy rule to a commit, ticket, RFC, ADR, or approved threat-model requirement.
- Review the delta: Trigger analysis from pull requests, infrastructure changes, identity grants, deployments, and external discovery, then inspect the exposed surface before release.
Keep the model honest as systems evolve
AI agents make artifact linkage more important, not less. An agent may generate a route, modify an authorization check, add a package, create an integration, or invoke a tool that wasn't part of the original design. The review system should identify those changes, show the new trust boundary or identity capability, and require the applicable policy before the code reaches deployment.
Attack surface analysis can maintain a current, decision-linked model of exposure and catch drift early. It can't promise zero incidents, replace secure coding, or substitute for threat modeling when a feature introduces a novel business action. Human reviewers still need to assess intent, abuse cases, and acceptable trade-offs.
The next practical moves are clear. Connect repository and ticket events to the inventory, add policy gates to CI, give AI coding agents security context and bounded permissions, and hold periodic design reviews for major architecture changes. The team that treats exposure as a changing property of the product will find forgotten endpoints before they become forgotten incidents.
DevArmor helps teams maintain living threat models, run security design reviews in existing developer workflows, enforce Policy-as-Code on pull requests, and verify that approved decisions match implementation changes. Visit DevArmor to connect attack surface analysis with the repositories, tickets, infrastructure, and AI-assisted delivery workflows where exposure changes.
Table of Contents
Subscribe